Oil Is Expensive. Getting It Delivered Is the Bigger Problem.
Brent is only part of the bill. Examine how export bottlenecks, tanker availability, insurance and refining constraints shape the cost of getting crude to buyers.
Research prepared October 28, 2026. Market news through October 27; official daily spot-price charts through October 20. All prices are nominal US dollars per barrel unless stated otherwise.
The conflict-driven rise in oil prices is familiar. The harder question for a buyer is what the Brent quotation leaves out: can the right crude reach the right refinery, on time, and at what total cost?
That is the delivery problem behind the headline price. Export access, vessel availability, insurance and refining constraints can change a buyer's bill even when the benchmark barely moves. Calling delivery the bigger problem is a statement about this operational challenge, not a claim that freight universally costs more than the oil itself.
The distinction matters for what comes next. A demand-led rally needs continuing economic strength. A supply-disruption rally can persist through weak growth, but it can also reverse abruptly when export access improves. Neither "oil must keep rising" nor "weak demand will immediately bring prices down" is an adequate framework.
Our central assessment is that near-term oil prices remain exposed to supply and logistics shocks, while the medium-term outlook depends on whether physical flows and inventory buffers recover faster than high prices damage consumption. This is a conditional assessment, not a trading recommendation.
Is Brent really making new record highs?
Not in every sense of the phrase.
Reuters' October 27 market report described Brent futures as near six-month highs, after trading above $117 the preceding week. The same report recorded a retreat that day: Brent settled at $113.88, down 1.67%, while WTI settled at $99.90. Diplomatic discussions had eased some immediate supply fears without resolving the shipping risks.
That supports a description of renewed multi-month highs and substantial volatility. It does not support an unqualified claim of a new all-time oil-price record.
Physical spot quotations tell a different, separately dated story. The EIA Europe Brent Spot Price FOB table showed $138.21 on April 7, $135.51 on October 2, and $115.22 on October 20, the latest observation visible in the table checked for this draft. The last figure was 16.63% below the April observation and 14.97% below the October 2 observation, calculated from that same series.
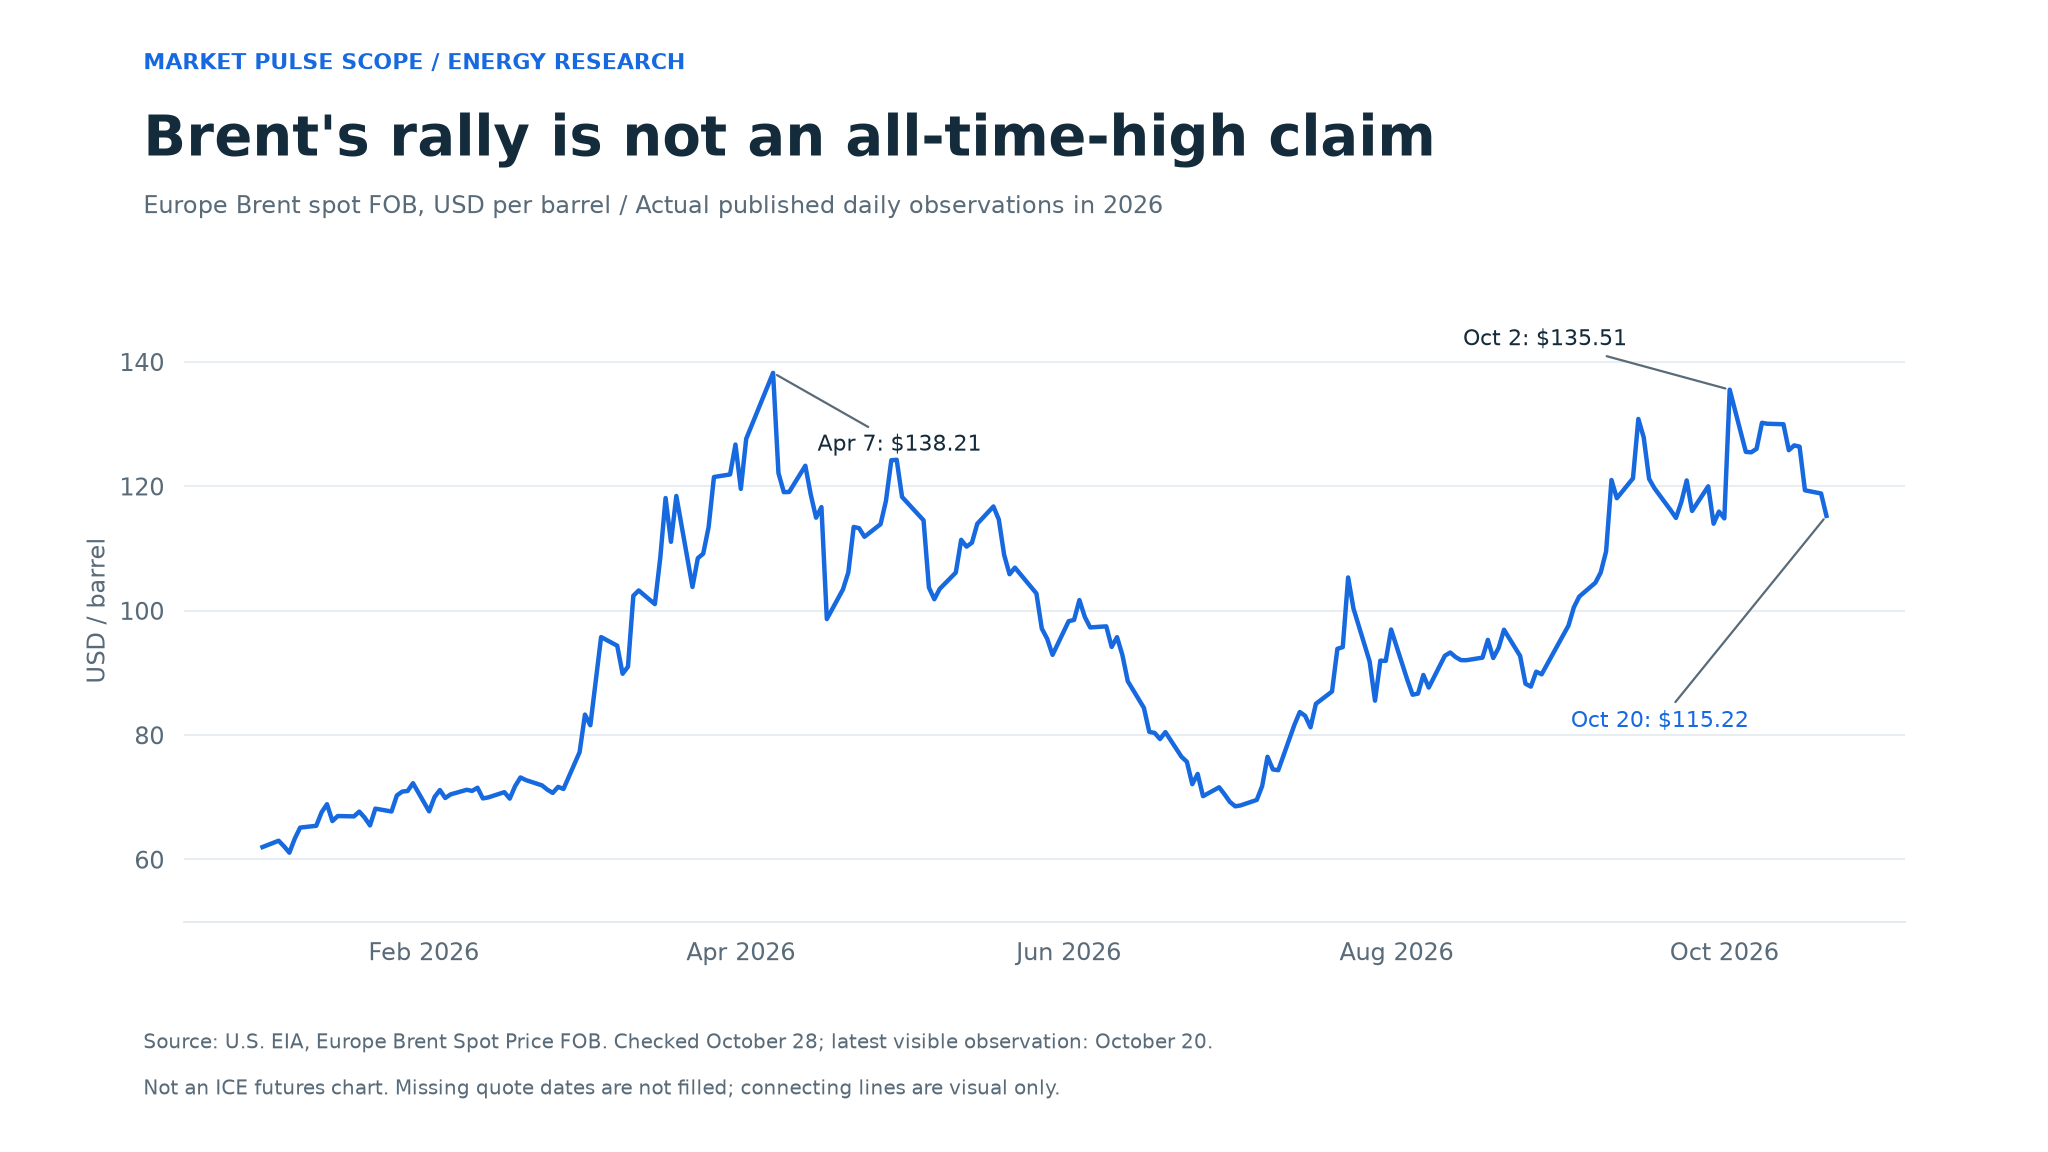
Figure 1. Official published daily spot observations, not a futures curve. Missing quotation dates are not filled; connecting lines are visual guides. The chart ends before the later futures news cited above.
Three distinctions prevent misleading comparisons:
- Spot versus futures: a physical assessment and a contract for later delivery answer different questions.
- Intraday versus settlement: a briefly traded high is not a closing or daily assessment.
- Recent versus historical high: a six-month peak does not establish an annual or all-time record.
The ICE Brent contract specification also makes contract expiry explicit. A rolling front-month chart changes delivery contracts over time; comparing it with a fixed contract or physical series requires care. A contract roll is not evidence that a physical cargo changed price by the same amount.
1. The important supply constraint is exportability, not just production
The oil market does not consume production targets. Refineries consume crude that can actually arrive.
The IEA's February Hormuz factsheet put 2025 oil and product flows through the strait at roughly 20 million barrels a day, about one-quarter of seaborne oil trade. It identified only 3.5-5.5 million barrels a day of alternative pipeline capacity capable of redirecting crude around the Gulf chokepoint. These are pre-crisis structural reference figures, not a measurement of today's traffic.
Our interpretation: available upstream capacity is a weaker safety buffer when the export route serving that capacity is also exposed. An additional barrel underground is not equivalent to an additional barrel loaded on a reliable vessel.
This creates a substitution problem. A refinery may bid for an alternative crude, but the replacement can have different sulfur content, yields and transit time. Paying more for a substitute does not necessarily restore the refinery's original economics. The shortage can therefore appear in physical differentials and delivered costs before it is fully visible in aggregate production statistics.
It also explains why the same political headline can have different price effects. A threat to an already-constrained route may have limited incremental impact. Damage to a functioning bypass can remove an option the market had relied on, making the marginal disruption much more important.
2. Shipping turns a regional disruption into a global price problem
The EIA's October global oil outlook described tanker risk, higher insurance costs and longer routes as additional pressure on delivered crude costs. It estimated September production shut-ins at 4.8 million barrels a day, down from 5.8 million in August. The improvement did not eliminate export constraints.
For a buyer, a simplified cost relationship is:
Delivered crude cost = benchmark price + grade differential + freight + insurance + other delivery costs.
The last four terms are not constant. A flat benchmark can coexist with a rising refinery acquisition cost if vessels become scarce or insurance rises. Conversely, a fall in futures does not guarantee immediate relief for a refinery committed to expensive transportation.
Our interpretation: the marginal cost of obtaining secure delivery matters more than the headline futures move alone. Longer voyages tie up vessels for more days, reducing effective transport capacity even without a reduction in the fleet's size. A bottleneck can thus compound itself: longer routes reduce vessel availability, which raises freight costs, which makes replacement supply less attractive.
There is a limit to this mechanism. If the landed cost rises too far relative to product revenue, a refinery may cut runs rather than compete indefinitely for crude. Expensive shipping can support delivered prices while simultaneously weakening crude demand. This is why a logistics-driven rally can contain the seeds of its own reversal.
3. The diesel market helps explain why this is not just a crude story
Crude is an input. Diesel, gasoline and jet fuel are outputs. A shortage in one output can change how much refiners are willing to pay for the input, but refineries cannot turn every barrel into the single product most needed.
In its October 22 refinery analysis, the EIA reported US refinery utilization above 95% on average from May through September, the highest for those months since 1998. It attributed the high operating rates largely to tight product supplies and strong demand for US distillate exports. Yet total output was only the highest since 2019, because refining capacity had declined by 4% since then.
Our interpretation: utilization alone is an incomplete measure of spare supply. A smaller system running harder may have less room to respond to a disruption than a larger system operating below its technical maximum.
This produces two opposing forces for crude prices. Strong diesel margins can encourage refiners to buy feedstock and maintain runs. But a damaged refinery, constrained port or unsuitable crude slate can prevent the extra crude from becoming usable diesel. In that case, product prices can remain high without a proportional increase in crude demand.
For businesses, this distinction is practical. An airline's jet-fuel exposure and a transport company's diesel bill cannot be fully explained by Brent alone. The relevant product differential, contract terms and local taxes may dominate a short-period cost change.
4. Inventories can tighten even when consumption is falling
The accounting relationship is simple:
Change in stocks = supply minus demand, after accounting for measurement and timing differences.
Both supply and demand can fall, while inventories still decline if supply falls faster.
The IEA's October Oil Market Report, published October 14, forecast a 2.6 million barrel-a-day decline in 2026 demand. It also reported observed global stocks 509 million barrels below end-February levels. September's relatively small net inventory decline concealed a much larger fall in on-land stocks, substantially offset by more oil on water. These are the IEA's estimates and forecasts, not figures independently measured by this article.
Our interpretation: oil in transit and oil immediately available to a refinery are not identical buffers. A cargo can count toward an inventory total while still being weeks away, exposed to disruption, or commercially committed elsewhere. Aggregate stock stabilization can therefore overstate the improvement in prompt availability.
The distinction is also a warning against overly simple demand narratives. Falling consumption during a supply crisis is not automatically a sign that the market is becoming comfortable. Some of that decline may reflect restricted availability and unaffordable fuel rather than a voluntary reduction in underlying need.
Emergency stocks remain a counterweight. On October 7, the IEA said approximately 325 million barrels had been released under its March collective action, with substantial public reserves still available. Stock releases can bridge a disruption; they do not permanently replace functioning production, refining and export routes. Announced volumes should also be distinguished from barrels actually delivered to the market.
5. What the Brent-WTI gap can, and cannot, tell us
Brent and WTI differ in geography, quality, delivery arrangements and market structure. Their difference can reveal relative stress, but it is not a pure measure of geopolitical risk or tanker freight.
On the matched October 20 observation date, EIA spot assessments were $115.22 for Brent and $107.89 for Cushing WTI. The calculated difference was $7.33 a barrel. The underlying sources are the Brent spot table and the WTI spot table.
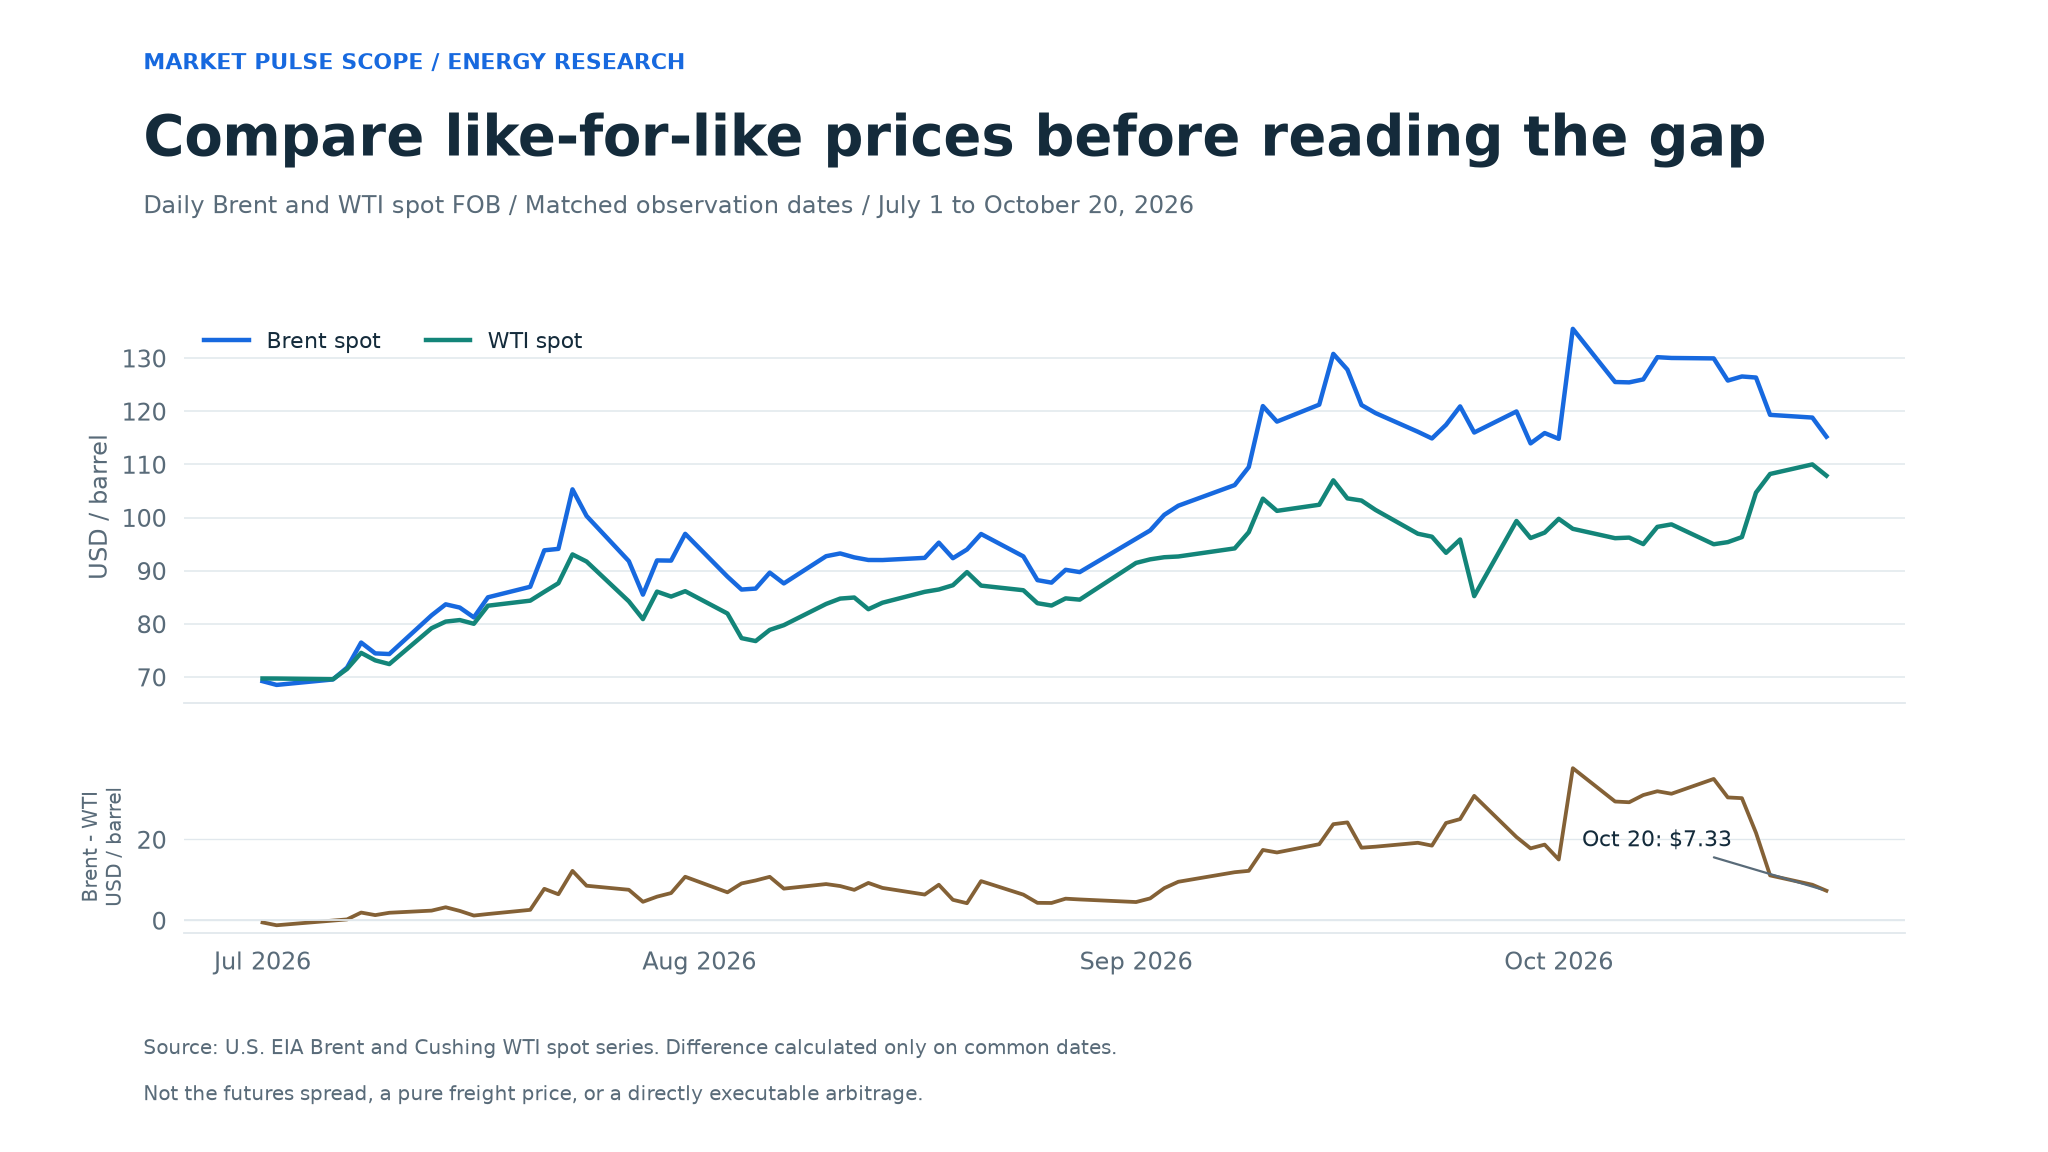
Figure 2. Both series are EIA spot FOB assessments on common dates. The lower panel is subtraction, not a separately observed freight rate or an executable arbitrage. Neither panel uses futures settlements.
Our interpretation: a widening difference can be consistent with greater stress in internationally traded crude than in inland US supply, but it cannot identify the cause by itself. Export infrastructure, crude quality, regional refinery demand and timing also matter. A persuasive explanation needs evidence from physical differentials, export flows and freight, not a spread chart alone.
The same discipline applies to risk premiums. It is tempting to subtract a pre-crisis price from today's price and call the remainder "geopolitics." That would also sweep in changes in consumption, inventories, interest rates and other market conditions. This article does not claim to isolate a precise dollar risk premium.
What could happen next? Three conditional scenarios
The EIA's October forecast overview projected Brent spot averaging $105 in the fourth quarter of 2026 and $84 in 2027. The forecast inputs were finalized October 1. Those figures are dated agency forecasts, not current futures quotes, guaranteed outcomes or our price targets.
Our scenario framework focuses on what would make the market tighten or loosen. No probabilities are assigned because the evidence here does not support calibrated odds.
Scenario A: Gradual normalization
Reliable export flows improve, freight pressure eases and usable inventories rebuild. Physical premiums soften; crude can decline even before every operational problem is repaired. Renewed attacks, interrupted bypass flows or persistent product shortages would challenge this scenario.
Scenario B: Renewed squeeze
Important infrastructure or shipping suffers further sustained disruption. Buyers compete for prompt alternatives, lifting delivered costs and volatility. Rapid restoration of flows and sustained stock replenishment would challenge this scenario.
Scenario C: Demand-led reversal
High fuel costs and weaker activity outweigh the remaining supply constraint. Refinery demand and product margins soften, allowing crude to fall despite continuing geopolitical risk. Persistent inventory draws alongside resilient product consumption would challenge this scenario.
These outcomes are not mutually exclusive over time. A renewed squeeze could be followed by a demand-led reversal. A diplomatic announcement could lower the financial risk premium immediately, while cargo availability improves only gradually.
The October 4 OPEC+ statement said the seven participating countries would maintain September required production levels for November, with another meeting scheduled for November 1. The useful distinction is between a target, actual output and completed exports. A production announcement alone does not resolve a transportation bottleneck.
A practical dashboard: five signals worth watching
Rather than react to every high-price headline, test the supply-tightness thesis against a small set of observable changes:
- Completed exports and reliable arrivals. Look for sustained improvement, not just a vessel movement or an announced reopening.
- Commercial crude and product stocks. Track their location and seasonal context, and keep emergency reserves separate.
- Freight and insurance. Ask whether a lower benchmark is actually reducing delivered costs.
- Diesel margins and refinery runs. Watch whether product scarcity is encouraging crude purchases or whether feedstock costs are forcing run cuts.
- Physical differentials and the futures curve. Persistent prompt premiums or backwardation can support a tightness interpretation, but this article has not independently verified a current full futures curve.
For chart work, compare the same frequency and quotation basis. Market Pulse Scope's trend comparison tool can help organize recorded series, while historical comparison can examine comparable periods. Normalizing lines to a common baseline shows relative change; it does not make different crude grades interchangeable or establish causation.
For procurement, begin with exposure rather than a price prediction. An illustrative 100,000-barrel purchase exposed to a $10-a-barrel benchmark increase has a $1 million benchmark-cost sensitivity before differentials, freight, insurance, taxes, currency and hedging. This is arithmetic, not a market quotation or a recommendation. The purchase-cost calculator can support that kind of explicit assumption-based comparison.
Bottom line
The strongest explanation for elevated oil prices is not simply that demand is booming, nor that every political shock creates a permanent new price floor. It is that disrupted delivery, constrained refining and thinner usable buffers can make the next available barrel unusually valuable.
Our near-term assessment is therefore cautious about assuming a smooth return to cheaper oil. Our medium-term assessment is equally cautious about extrapolating recent highs: restored flows, rebuilt inventories and weaker consumption could undermine prices even while the geopolitical situation remains unsettled.
For buyers, the key is the total cost and reliability of delivery, not Brent alone. Sustained export recovery, easing transport costs and inventory rebuilding would weaken the supply-tightness case and support lower prices.
Data and interpretation notes
The two charts use downloaded EIA daily spot tables and end on October 20, the latest visible observation when checked. October 27 futures reporting is a separate observation set. Agency forecasts retain their publication dates and assumptions. No forecast curve, interpolated quote or estimated transaction price has been inserted into the charts.
The site's Brent and WTI pages provide separate recorded reference series. Their observation labels should not automatically be read as exchange trading-session dates or substituted for the EIA spot assessments above. Website prices are not the numerical basis for the article's market-high claims or charts.
This article separates sourced observations, agency forecasts, illustrative calculations and our interpretation. It is general market research, not financial, trading or purchasing advice. Prices may be delayed or revised. All linked sources and market observations should be rechecked before publication if the review occurs on a later date.