SSD Prices in October 2026: What the Latest Data Shows
Selected SSD channel benchmarks fell in the week to October 27. Compare 1TB and 2TB prices, calculate price per GB, and understand why retail, OEM and enterprise markets can move differently.
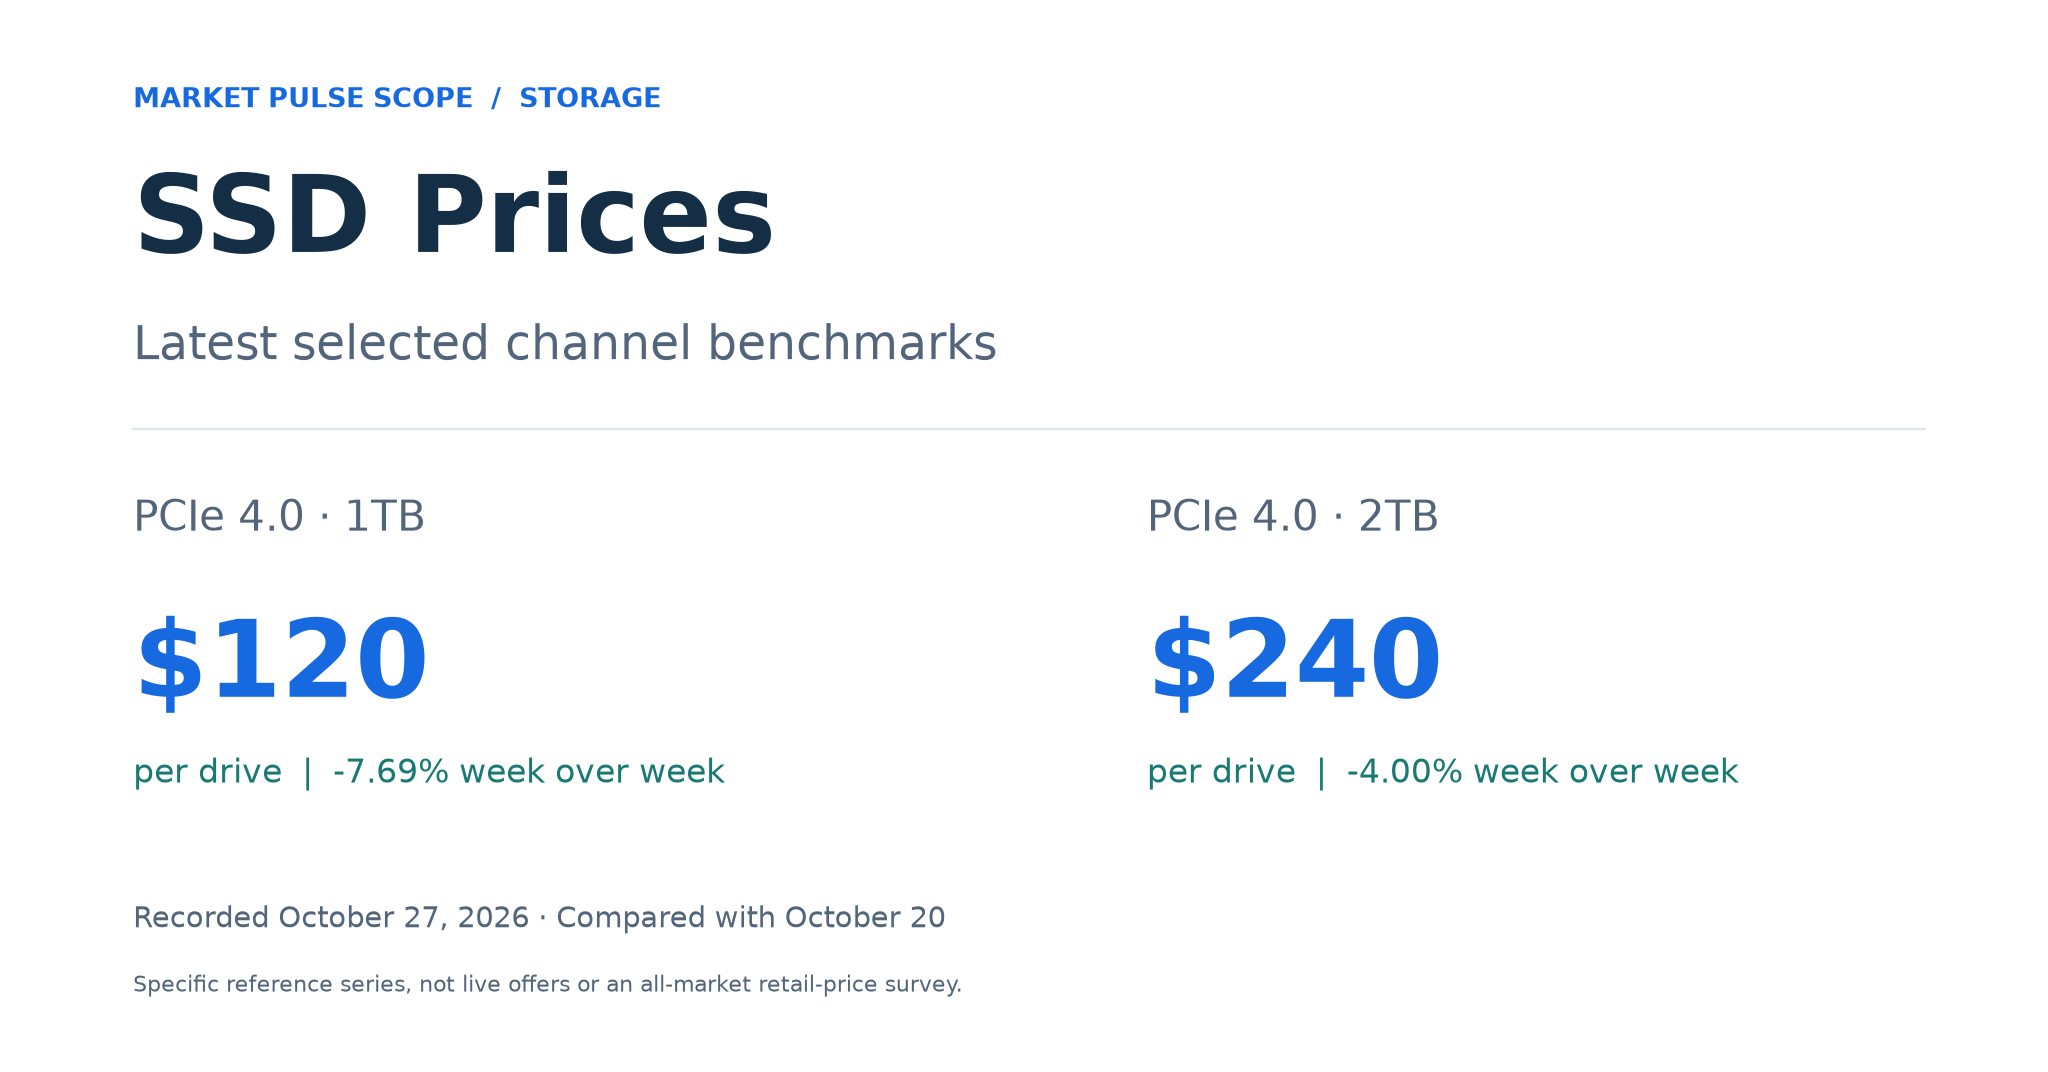
Price observations through October 27, 2026. Production data checked October 28, 2026.
SSD prices are not moving in one direction across every part of the storage market. In the latest weekly observations checked for this article, nine selected channel benchmarks on Market Pulse Scope declined, even as enterprise storage remained a focus of industry pricing pressure.
Two figures capture the distinction: the tracked PCIe 4.0 1TB channel benchmark fell from $130 to $120 per drive, while the 2TB benchmark fell from $250 to $240, between October 20 and October 27. Those changes were 7.69% and 4.00%, respectively. They describe these specific recorded series, not every SSD on sale.
For anyone researching SSD prices, the useful question is therefore not just whether storage is becoming cheaper. It is which specification, which quotation basis, and over what period.
What are the latest SSD prices?
The following selected channel benchmarks were recorded on October 27, 2026, in US dollars per drive. Each weekly comparison uses an actual October 20 observation from the same series:
- PCIe 3.0 512GB: $70, down from $75, a 6.67% decline. View this price history.
- PCIe 3.0 1TB: $110, down from $116, a 5.17% decline. View this price history.
- PCIe 4.0 512GB: $76, down from $80, a 5.00% decline. View this price history.
- PCIe 4.0 1TB: $120, down from $130, a 7.69% decline. View this price history.
- PCIe 4.0 2TB: $240, down from $250, a 4.00% decline. View this price history.
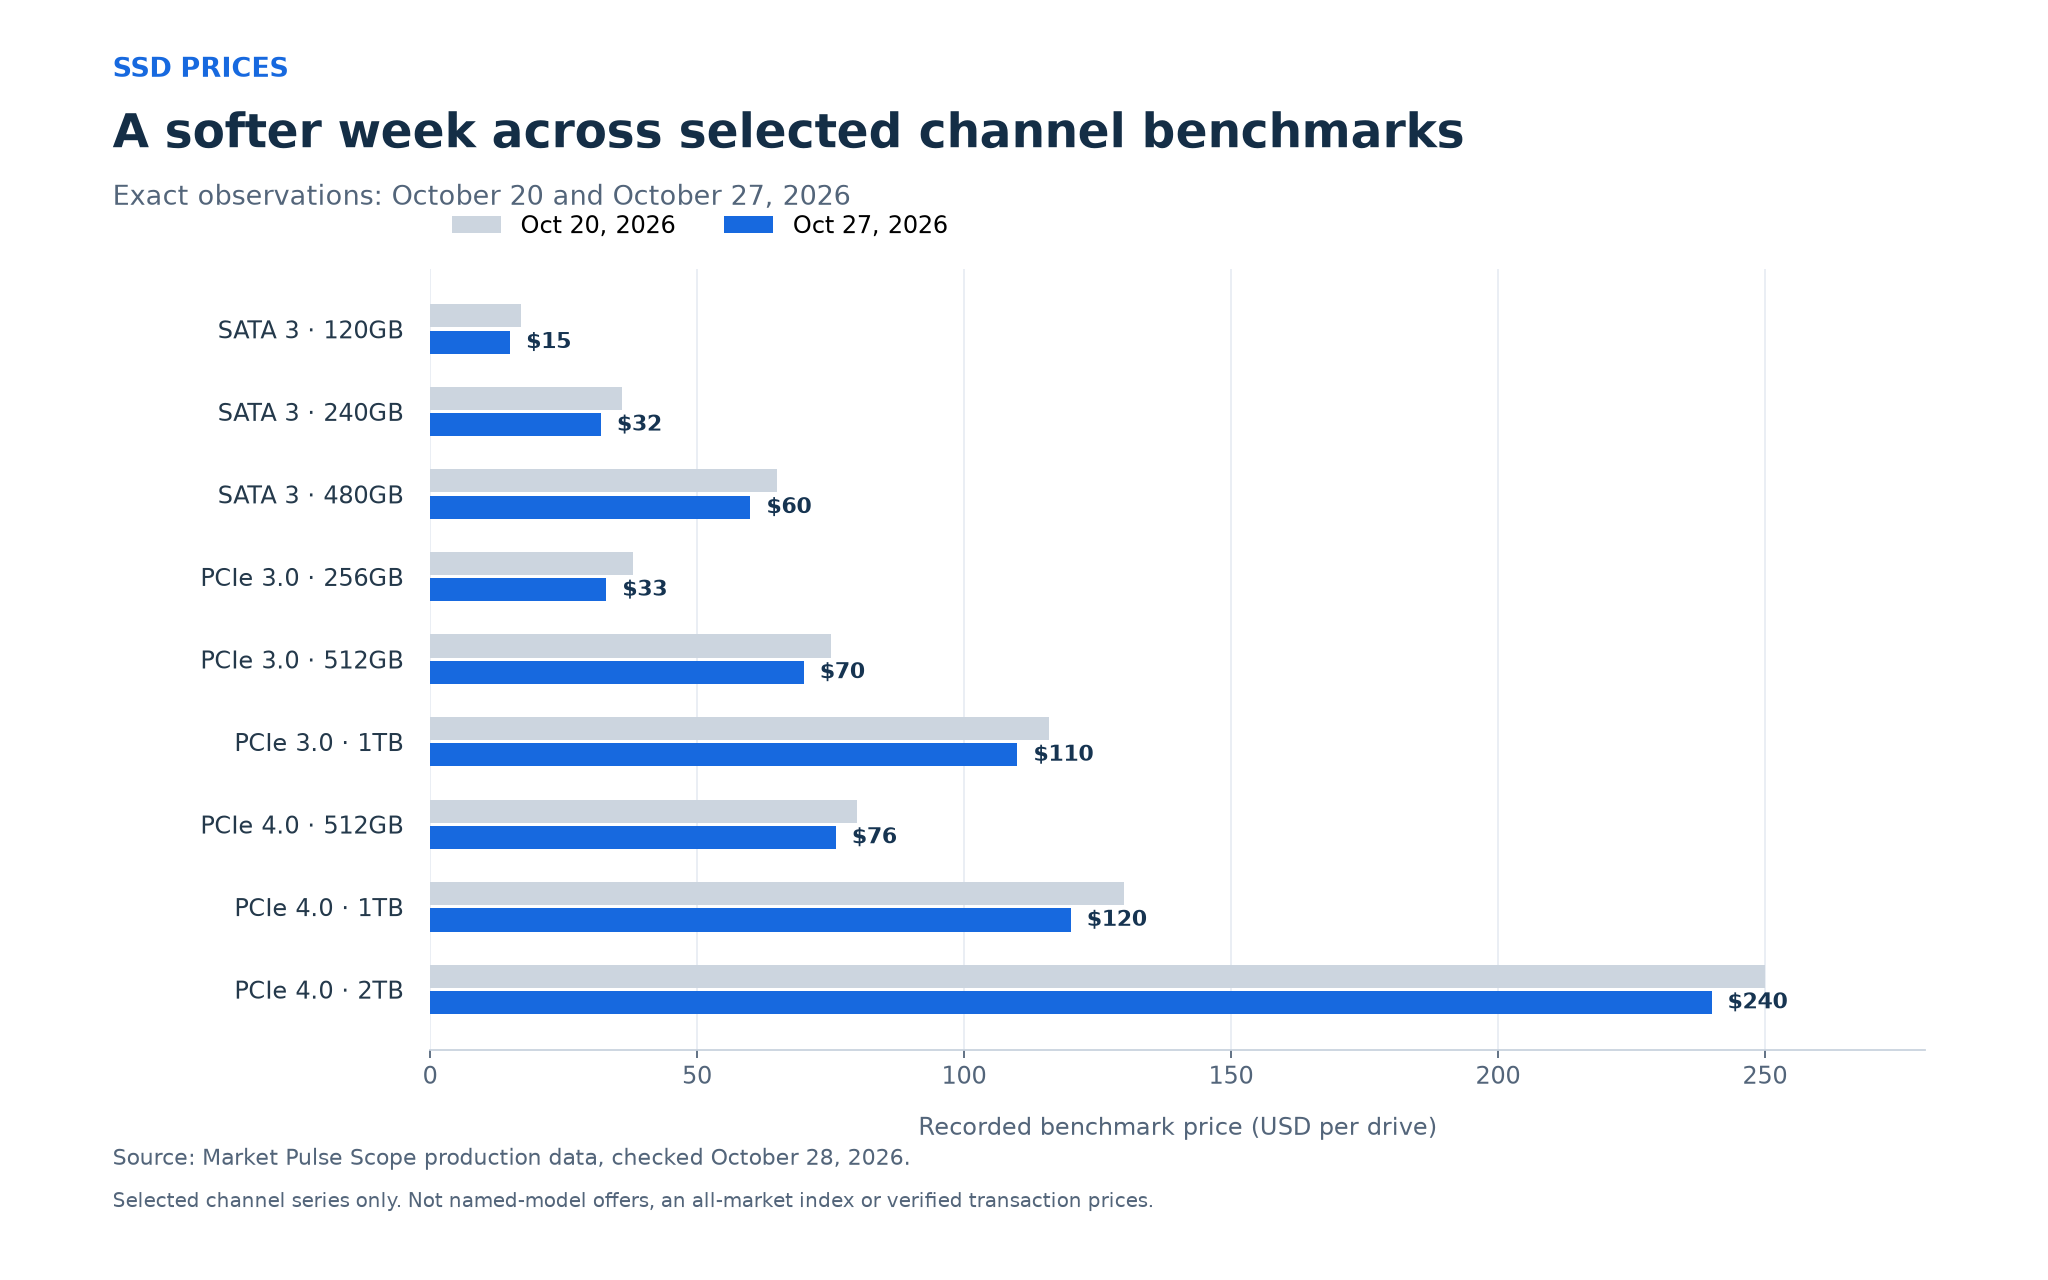
Across the nine channel series shown in the chart, declines ranged from 4.00% to 13.16%. This is a selected sample, not a sales-weighted SSD price index. It excludes separate OEM/industry series and does not establish what an individual retailer charged for a named model.
The observations are returned by the site's production history interface as non-estimated weekly records. That describes their database classification; it is not independent verification of completed transactions. A recorded benchmark is a reference point, not a live offer, a guaranteed purchase price or a market-wide retail median.
How much does a 1TB SSD cost compared with a 2TB SSD?
In this snapshot, the selected PCIe 3.0 1TB channel series was $110, while the PCIe 4.0 1TB series was $120. The difference between these reference series was $10, or 9.09% of the PCIe 3.0 value. It should not be interpreted as a controlled, same-model measurement of the value of upgrading an interface.
The PCIe 4.0 2TB series was $240: exactly twice the 1TB series at $120. That means both worked out to $0.120 per advertised GB.
This is a useful counterexample to a common assumption: a higher-capacity SSD does not automatically have a lower cost per GB. Check the arithmetic rather than assuming a capacity discount.
Calculate SSD price per GB
Use the following calculation:
Price per GB = recorded drive price / advertised capacity in GB.
For the selected PCIe 4.0 series:
- 512GB: $76 / 512 = approximately $0.1484 per GB.
- 1TB: $120 / 1,000 = $0.1200 per GB.
- 2TB: $240 / 2,000 = $0.1200 per GB.
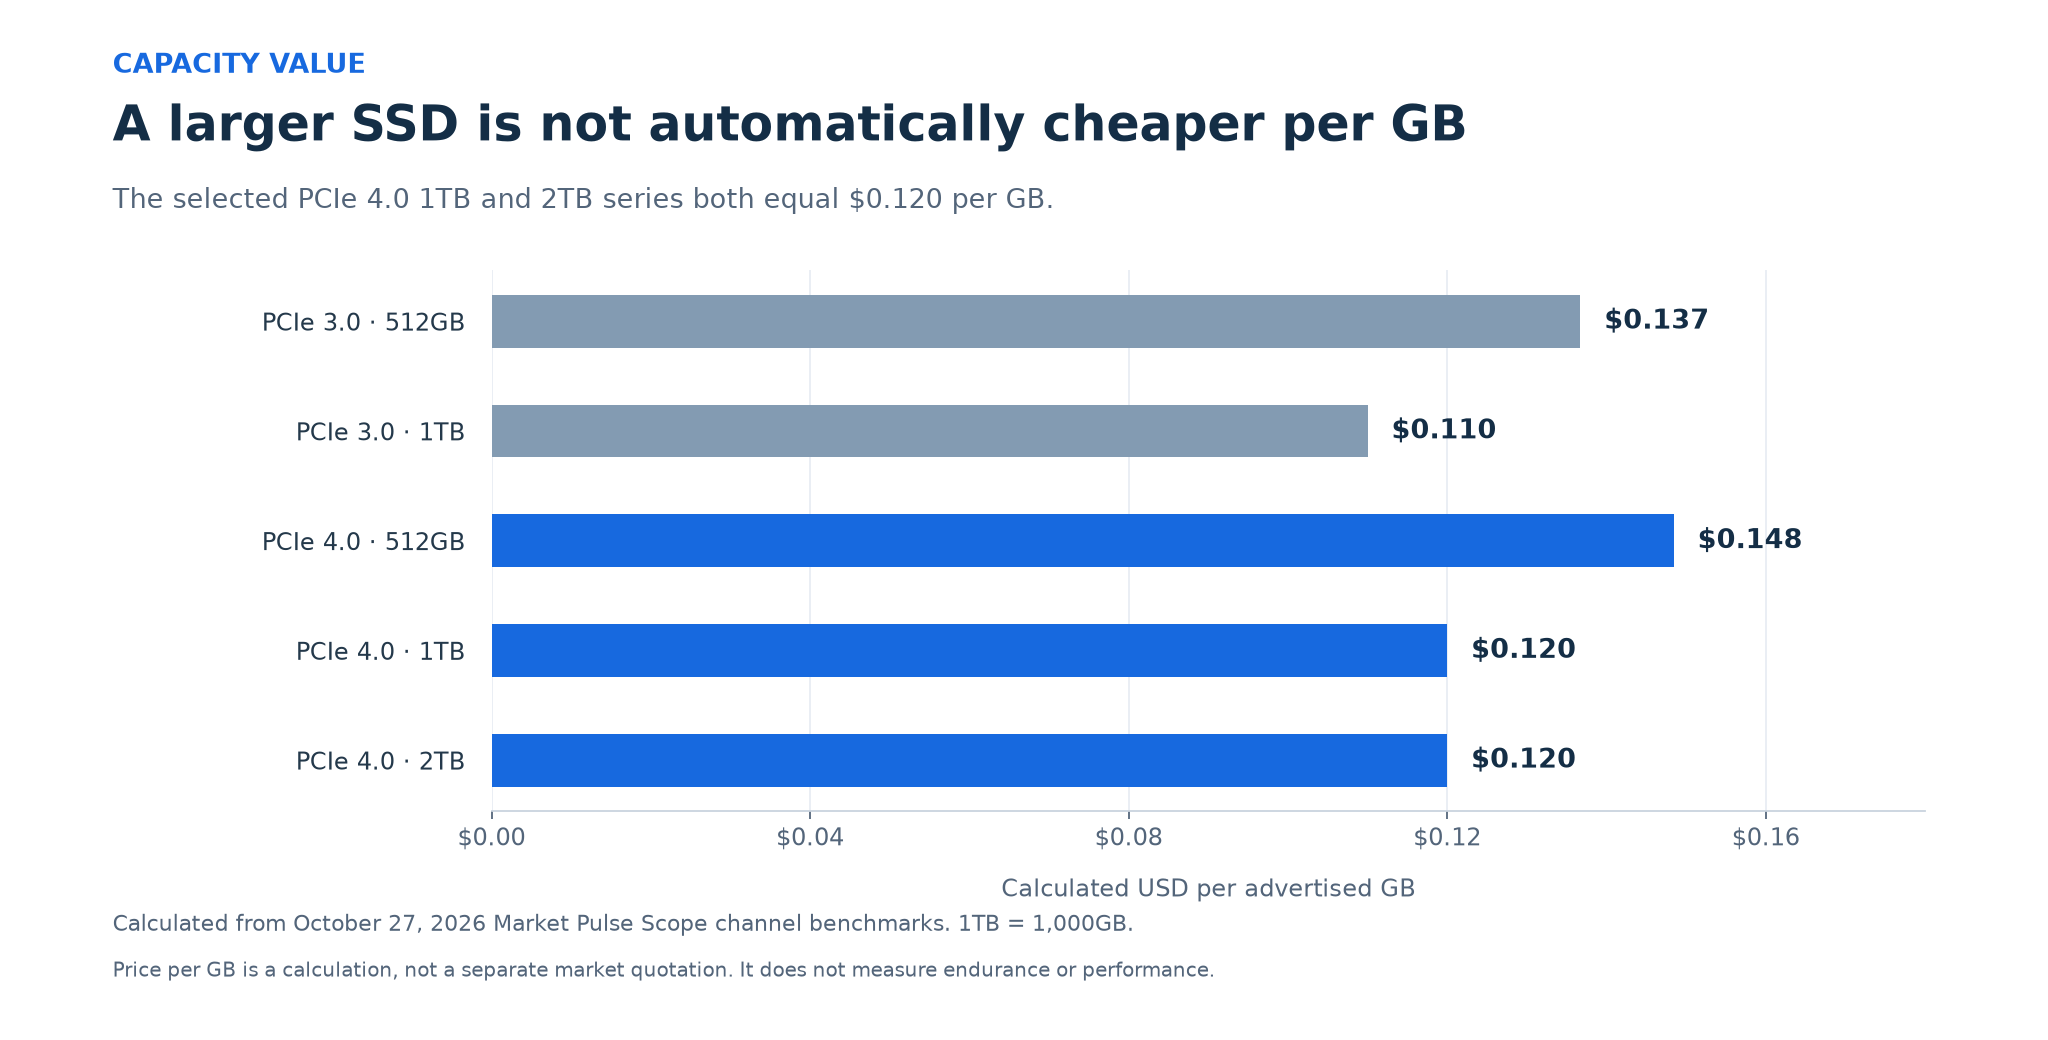
Here, 1TB means 1,000GB of advertised capacity, not 1,024GB. These are calculated ratios, not additional market quotations. Usable formatted capacity, endurance, warranty and performance remain separate considerations.
Why can SSD prices fall while NAND and enterprise storage remain under pressure?
The NAND market connects these products, but it does not make them interchangeable.
In its October 28 NAND Flash Market Bulletin summary, TrendForce described weak PC demand, ample OEM inventories and more aggressive spot-market selling. It also reported continuing pricing power among disciplined NAND suppliers and anticipated substantial enterprise SSD contract increases supported by AI demand.
That combination helps explain why a simple "AI demand means all SSD prices must rise" narrative is inadequate. Inventory held by module makers, procurement contracts and demand for finished drives can transmit upstream conditions at different speeds.
Our interpretation: the weekly declines in this article are consistent with a segmented market, but the price sample alone cannot prove which inventory or demand factor caused them. It also cannot establish that the longer-term NAND cycle has reversed.
Compare SSD prices without mixing unlike products
A reliable comparison starts by keeping the series definition stable.
- Keep channel and OEM/industry quotations separate. Similar capacity and interface labels do not establish identical specifications, contract terms or qualification requirements. An OEM-labelled series should not automatically be treated as an enterprise SSD benchmark.
- Check the interface and physical compatibility. M.2 describes a form factor, not a guarantee that a drive uses SATA or PCIe/NVMe. Confirm the host's supported protocol before treating two products as alternatives. Kingston's SSD FAQ explains these distinctions.
- Check NAND type and workload requirements. TLC and QLC store different numbers of bits per cell. Capacity and headline speed alone do not describe write endurance or sustained performance; review the particular drive's specifications. Micron's NAND guide provides the technical background.
- Match observation dates. Compare recorded values for the same date or state the difference explicitly. Do not turn a missing weekly observation into a zero change.
Price per GB is a useful screen, not a complete ranking of SSD quality.
How to read SSD price history
Start with the SSD price directory and open the exact series you want to follow. Then choose a period suited to the question:
- A weekly comparison identifies the latest recorded adjustment.
- A three- or six-month window helps distinguish one update from a broader direction.
- A longer history adds context, but only while the series' specification and quotation basis remain comparable.
The price trend comparison tool can place selected series on one chart. Normalized percentage changes help compare direction across capacities; actual-price mode preserves the quoted monetary values. Neither mode makes unlike products equivalent.
For a before-and-after check, use historical price comparison. The weekly changes above use (new price / earlier price - 1) x 100. Missing periods should remain gaps, not invented transactions.
What could happen to SSD prices next?
One declining weekly snapshot is not enough to forecast the next quarter. A more useful framework is to watch competing conditions:
- Further easing: if channel inventories remain high and end demand stays weak, distributors may continue lowering quotations or running promotions.
- Stabilization: if those inventories clear while replacement costs stay firm, the latest reductions may slow rather than develop into a sustained decline.
- Renewed pressure: tighter NAND availability or stronger procurement could lift replacement costs, although pass-through would vary by product and contract.
These are conditional scenarios, not price targets or assigned probabilities. The key test is whether subsequent observations confirm the move across comparable series, rather than whether a single headline sounds bullish or bearish.
Frequently asked questions about SSD prices
Are SSD prices going down?
The nine selected channel benchmarks examined here fell between October 20 and October 27, 2026. That finding should not be extended automatically to every branded retail product, OEM contract or enterprise SSD.
Is a 2TB SSD always better value than a 1TB SSD?
Not on price per GB alone. In the selected PCIe 4.0 snapshot, $240 for 2TB and $120 for 1TB both equal $0.120 per advertised GB. Actual product suitability also depends on compatibility, performance, endurance and warranty.
Are these the lowest SSD prices available online?
No. They are dated benchmark observations, not a comprehensive shopping comparison or a promise that a retailer will sell a specific drive at that price.
Does a NAND price change mean my preferred SSD will change price immediately?
No. A finished drive's specification, components, inventory position, sales channel and contract arrangements can affect the timing and size of any adjustment.
Bottom line
The latest checked channel observations show lower SSD prices across the selected sample, with PCIe 4.0 1TB at $120 and 2TB at $240 on October 27. The stronger conclusion is not that every SSD is becoming cheaper, but that quotation basis, capacity and date matter as much as the headline price.
Compare like-for-like histories, calculate cost per GB, and check an actual model's specifications before interpreting a benchmark as a purchasing opportunity.
Methodology: prices were read from Market Pulse Scope's public production catalog and checked against exact October 20 and October 27 history observations on October 28, 2026. Calculations use unrounded values, with displayed percentages rounded to two decimals. No daily prices were interpolated and no missing observations were synthesized. External commentary uses publicly accessible summaries, not the contents of paid reports. Data may be delayed, incomplete or inaccurate; this article is for reference, not financial or purchasing advice.